 (7 votes, average: 5.00 out of 5)
It won’t be unusual to say that think-cell is among the most full-featured PowerPoint add-ins out there. This add-in has been licensed to nearly a million users in over 23,000 organizations worldwide, and there are a large number of business professionals who would not be comfortable creating slides without think-cell installed. In fact, it’s quite normal for PowerPoint trainers to be asked to impart training in think-cell as well.
think-cell is one of those programs that’s like a habit. Users across organizations have been trained to use its powerful features to create aesthetic, well-laid slides that live up to company-branding standards. These users are now used to working a certain way. Let’s compare them with typical PowerPoint users who haven’t worked much with think-cell yet. They are not so well-versed with think-cell’s interface elements, which are not too PowerPoint-like. So yes, there’s that initial period when think-cell newbies get a little intimidated with its interface and features. However, if they are persistent, they discover the amazing potential that think-cell provides, helping them create slides that would take hours in mere minutes.
On the other hand, I have witnessed over the last few releases of think-cell, a distinct improvement in making the product more friendly to new users. This is a welcome move that’s sure to attract many more users. In addition, think-cell’s features keep getting more powerful.
Finally, there’s a perception that think-cell’s licensing terms are more oriented towards larger organizations rather than towards individual presentation designers or freelancers. How true is that perception? We will find out soon.
In this post, we will look at the five best features in think-cell. We will also talk with Robin Jung of think-cell to understand their licensing concept better thereafter. Before we proceed with this post, let me introduce you to Robin Jung, who is the Head of Product Management at think-cell, and used to be a strategy consultant and heavy think-cell user himself. Robin and I have had several calls over the last few months while I was researching for this feature, and he has been so patient and forthcoming all the time. I wish to thank him for his support.
Before we feature Robin, and talk about think-cell’s licensing, let us explore the five best features in think-cell. We are using think-cell 11, which is the current release version.
Five Best Features in think-cell
1. Waterfall Charts
Unlike the native waterfall charts that you can create in PowerPoint 365, the waterfall charts you create using think-cell are more intuitive to work with, and also provide you with more options than you can imagine. In PowerPoint 365, you need to right-click individual data points and select the Set as Total option from the ensuing menu. None of this change is visible in the data contained within Excel, and this can be very confusing. Plus, you need to update these subtotal and total values all the time. If just one positive or negative value within the non-total columns changes, you need to recalculate all values again for subtotal and total columns.
With think-cell, you don’t need to calculate totals or even add formulas. You just need to type in the character e (‘e’ indicates ‘equal’) in the subtotal or total cell within Excel, and think-cell will take care of the rest! Also, unlike in PowerPoint, waterfall charts created in think-cell can contain segmented columns, as shown in Figure 1, below.
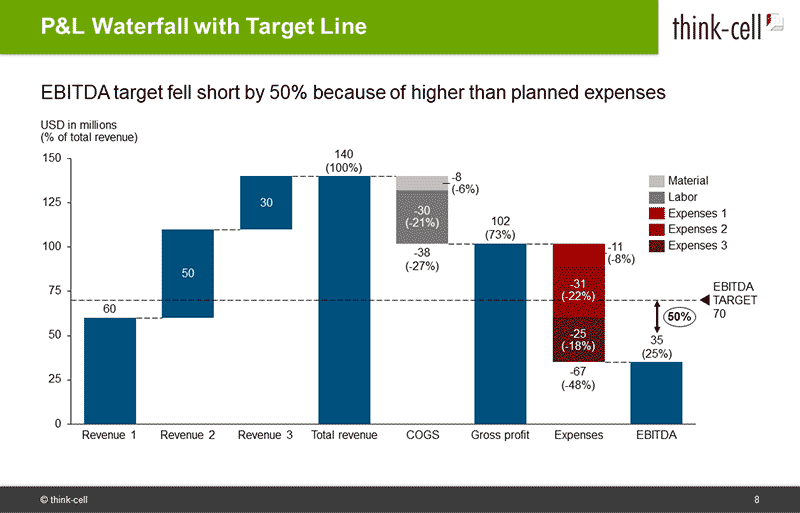
Figure 1: Waterfall chart with segmented columns
Best of all, think-cell’s waterfall charts are completely compatible with PowerPoint’s and Excel’s charting engines. To confirm, you can quickly deactivate think-cell and you can still view the charts in both PowerPoint’s editing and Slide Show views. You can also edit the think-cell charts as if you were working with native PowerPoint charts. This compatibility also ensures that you can share charts with recipients who may not have think-cell installed on their systems.
Temporarily Deactivate think-cell
Do you want to know what your think-cell charts look like when there’s no think-cell installed on your system? Doing so can help you replicate the scenario when you share charts with others outside your organization who don’t have think-cell installed.
This objective is easy to accomplish, and you need not uninstall think-cell or even disable it within the Add-ins dialog box. All you need to do is to access the Insert tab of the Ribbon and locate the think-cell group. Here, click the Burger icon to bring up the menu that you see within Figure 2, below. Now, click the Deactivate think-cell option, highlighted in red within Figure 2.
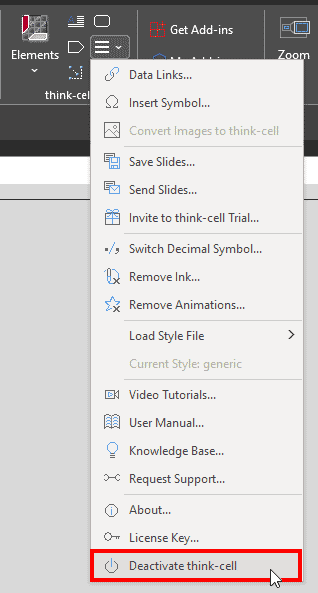
Figure 2: Deactivate think-cell
To activate think-cell again, you access the Insert tab of the Ribbon again and click the Activate button within the think-cell group, as shown in Figure 3, below.
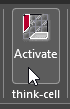
Figure 3: Activate think-cell
Here is an informative video tutorial about creating and editing waterfall charts in PowerPoint using think-cell.
2. Gantt Charts
think-cell can create some detailed Gantt charts as well. This video will show you some basics.
Of course, PowerPoint cannot create Gantt charts natively, although there are some other third-party add-ins that can create them. Yet, think-cell probably has the best implementation of this feature. Its Gantt chart implementation feels like a complete app in itself, and you have control over every small nuance. When you first insert a Gantt chart using think-cell, you see four elements:
- Activity List: This leftmost column contains the labels (names) for all activities you want to show. By default, these are just named Labels, but you can rename them to whatever you need.
- Timeline: This area on the right is the timeline that contains a selection of dates on the top.
- Dateline: This is the selection of dates placed above the timeline.
- Milestone: These are stops on the timeline that can be set to an automatic date.
Each element is customizable and as you create your Gantt chart by adding tasks, represented by Gantt bars, you will encounter many more Gantt chart elements. Some of these elements can be seen marked in Figure 4, below.
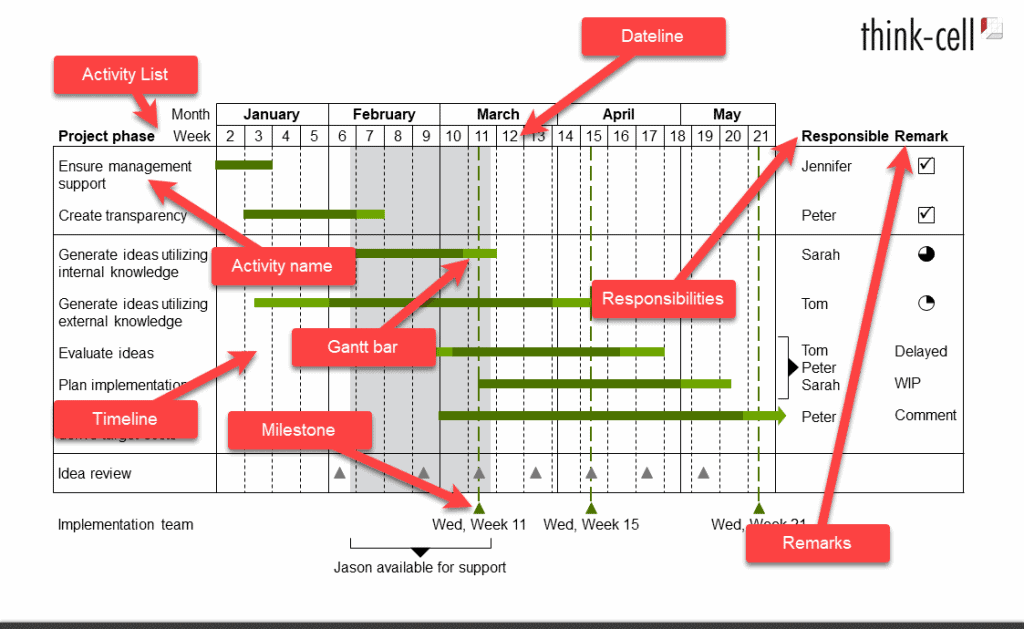
Figure 4: Common Gantt chart elements
Again, all Gantt charts you create in PowerPoint using think-cell are viewable by anyone you share these slides with, even if they don’t have think-cell installed, although they will not be able to edit these charts. Of course, you can still “edit” the Gantt charts without any think-cell functionality because the Gantt chart now is a bunch of shapes. The good news is that even if they do end up making some changes and send it back to you, think-cell has a capable option to carry over changes—you can decide which changes to accept, and which changes need to be ignored.
Here are some features that will help you create better think-cells Gantt charts:
- You can also resize and reposition your Gantt charts, and think-cell’s responsive layout engine will magically redo the Gantt chart without losing a single element.
- For instance, you can extend both the Timeline (with handles on the datelines) and the Activity List (e.g., by right-clicking and adding a new activity line below or even in between) and the Gantt chart will automatically adjust all existing elements. This sort of reflow for the layout is true not just for Gantt charts but anything you create using think-cell.
- You can create a dateline with only 5 days in a week and not show weekends. Even better, you can decide the days for the weekends, depending upon which country this Gantt chart is being created for.
- Gantt bars can be anchored to each other so that the end of one Gantt bar is linked to the beginning of another. When I extend the duration of the first Gantt bar, the anchored, dependent Gantt bar will only begin when the first one is finished. This means you need not recalculate project phases manually.
- Like most other charts in think-cell that have an associated datasheet, the Gantt chart is also associated with a data sheet. Additionally, it also has a calendar. To bring up the datasheet, you can either double-click the Gantt chart or click on the icon that shows when you hover in the bottom-right area of the Gantt chart. To bring up the calendar, you can double-click any time-related component within the Gantt chart, such as a chevron.
Robin Jung of think-cell adds, You can either create your Gantt chart manually with the help of the Calendar feature, or feed activities and dates automatically via the associated data sheet, or even from an external Excel file. That way, you can also update your Gantt chart based on your Excel model.
3. Annotations and Decorations
Another think-cell feature that’s compelling to use within PowerPoint slides is the comprehensive annotations and decorations available. While it may appear to you that annotations and decorations are different, they are the same as far as think-cell looks at them. They may certainly be relative though, because what may appear to you as a decoration may look like an annotation to someone else.
Here are some of these features:
Difference Arrows: think-cell lets you add difference arrows of two types: one with differences calculated between levels in a chart, such as within a stacked chart. The second type of difference arrow calculates the difference between totals in a chart. These difference arrows and other annotations can be added as part of your think-cell chart. In native PowerPoint, you would add these difference arrows manually, and they would not be part of the chart. The problem with that approach is that if you update chart values, you will have to manually update the difference arrows as well. With think-cell, you never have to worry about updating your difference arrows since they are automatically calculated and dynamically positioned, based on your chart data. Of course, this is not only true for difference arrows but for all annotation features in think-cell.
CAGR Arrows: CAGR or Compound Annual Growth Rates have their own arrows that you can use to annotate think-cell charts, as shown in Figure 5, below. CAGR arrows might look like trendlines in PowerPoint charts, but they are miles ahead as far as options and possibilities go. Mainly, you can see actual values accompanying the CAGR arrows. Plus, you can create CAGR arrows for the total values or for individual series values.
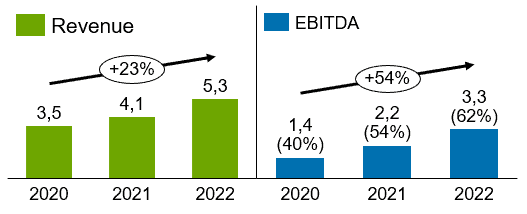
Figure 5: CAGR Arrows
Value Lines: Value lines can be added in PowerPoint too, but they are not part of the chart again. Using think-cell, Value lines can also be combined with Difference arrows so that one end of a Difference arrow is aligned to a Value line. Again, within PowerPoint, the placement of value lines is static, which requires manual rework whenever the data changes or the chart itself is resized/repositioned. In think-cell, these value lines can be data-driven or manually repositioned as required.
Connectors: Connectors are dotted lines linking some series or all series across categories in a chart, as shown in Figure 6, below. In addition, think-cell also provides universal connectors that can link between any two anchorable ends. These ends can also be on separate charts on the same slide.
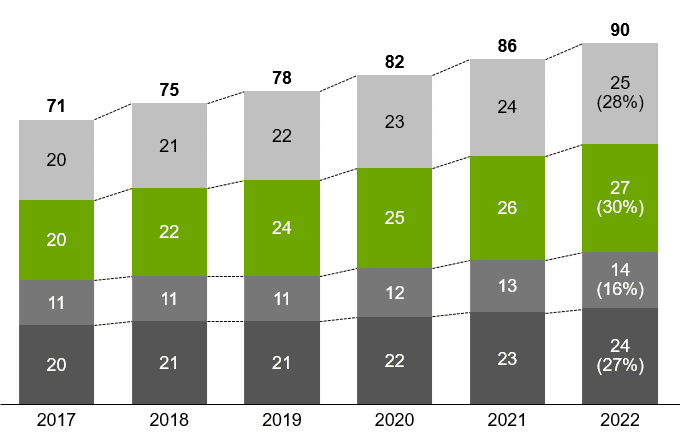
Figure 6: Connectors
Legend: Legends in think-cell again work seamlessly, although all series labels may disappear when you add a legend to avoid duplication. If needed, you can get back the series labels. The legend box can be placed wherever you need in the slide area; simple drag and drop is all you need. Interestingly, if you want to change the color fill of an entire series, you can just select and recolor an individual color swatch in the legend, and think-cell will recolor all elements of that series instantly within the chart.
Y-Axis or Value axis: This may sound strange or amazing, but most think-cell charts have no Y-axis, which is so different than what PowerPoint does by including an Y-axis in almost every chart. Of course, you can always add a Y-axis quickly. You can also scale up or scale down the Y-axis by manually dragging it. You can similarly drag the Y-axis from the left side of the chart to the right side. You can also choose between the logarithmic and linear scale in the axis.
Value Axis Breaks: In PowerPoint, adding a value axis break is a task for chart gurus, and even they can only create an illusion, with no dynamic behind-the-scenes integration with the underlying data. think-cell makes this option very intuitive. You can right-click anywhere on the Y-axis, and choose to add a break, as can be seen in Figure 7, below.
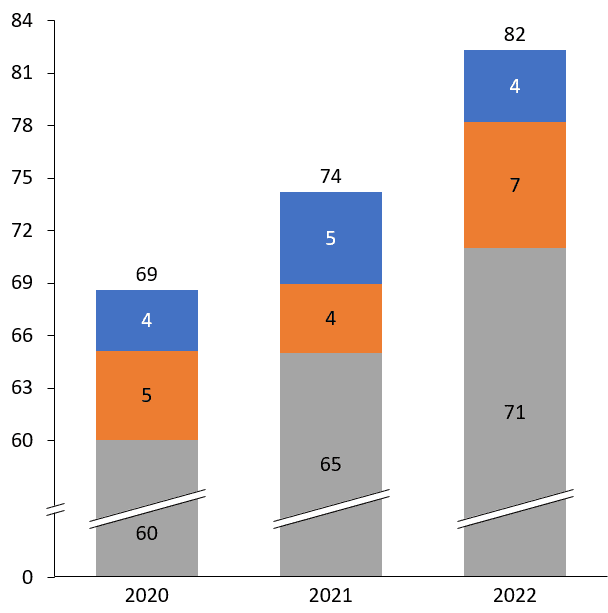
Figure 7: Value axis breaks
Here are some key points related to annotations and decorations:
- In PowerPoint, most (if not all) annotations and decorations have to be added manually to charts, which comes with a major drawback. In the case of Difference arrows, CAGR arrows, Value axis breaks, etc. they have to be manually calculated. This approach is prone to errors. For example, when the data of charts changes, those annotations can easily be overlooked or forgotten.
- Data-driven means that all features of think-cell are dynamically calculated, based on the chart data. They are thus automatically updated when the data changes. This is true for all labels, Difference arrows, CAGR arrows, average lines, Gantt milestones, etc.
- All think-cell annotations and decorations are data-driven, and each element is fully layout-ed. We discuss what layout-ed means next.
- Layout-ed objects are the core USP of think-cell, which guarantees optimal placement of all labels, annotations, and decorations in a way that they are both, visually clean (i.e. not overlapping) and appealing (where people would expect them to be).
Robin adds that These intelligent optimization algorithms are the result of two decades of graphics and design research, baked into a performance-driven layout engine.
4. Tables and Layout Engine
think-cell’s tables and in fact, its layout engine will prompt you to unlearn a little bit, but this unlearning is not a conflict with how PowerPoint’s native tables and slide layouts work. It’s just another way of looking at populating content on your slides.
One of think-cell’s USPs is its unique layout engine that works behind the scenes to ensure that all think-cell objects placed on your slide are symmetrically placed, and appear aesthetic to the eye. This automatic layout rendering is responsive to both the slide dimensions and the content on the slide; this means that your existing content will automatically reflow to fit within the slide area.
To begin with, this layout engine has been used in think-cell’s charts, but since think-cell 8, the aforementioned layout engine is also used for most think-cell elements, such as text boxes, process flows, and tables. These layout elements all share the following core capabilities:
- They adjust in position and size, based on the content and other elements on the slide to always optimize for design principles, such as same distance or white space.
- Without think-cell’s layout, PowerPoint users would need a set of alignment buttons, such as Align (Top, Bottom, Right, Left. Middle, and Center) and Distribute (Horizontally, Vertically), or Make Same (Height, Width, Both) to ensure a balanced layout on the slide.
- Even with these options, every change in content, such as adding a new process step in a process flow would change the alignment, distribution, or positioning of all elements, and then, the entire slide needs to be manually reformatted. However, think-cell automatically takes care of these options with its intelligent Layout engine.
- think-cell’s Layout engine can be a paradigm shift where users only focus on content and define the relation of elements to each other, while think-cell’s layout engine takes care of the rest.
With think-cell 11, there have been further improvements. The new table element, as shown highlighted in red within Figure 8, below, has been introduced.
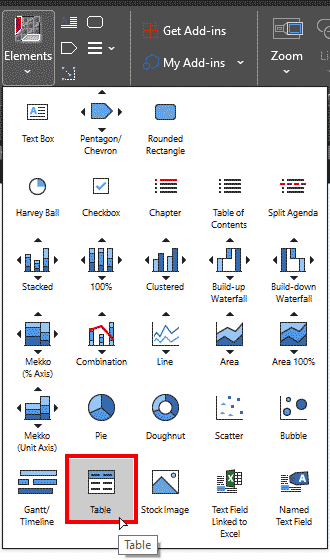
Figure 8: Insert table in think-cell
Unlike in PowerPoint, where you can choose the number of rows or columns you want within your new table, think-cell uses the minimal approach of two rows and one column, as shown in Figure 9, below. Notice that a datasheet shows up too, where you can edit data. Yes, this datasheet is Microsoft Excel, running behind the scenes, and it is interesting that think-cell tables in PowerPoint interact with Excel, especially since there’s no real connection between native tables in PowerPoint and Excel.
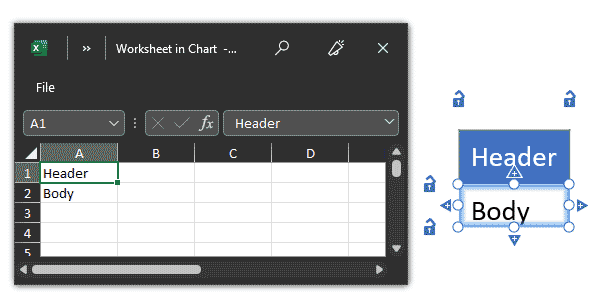
Figure 9: think-cell table with Excel sheet
Robin adds, The table combines the data-driven character of a chart with the optimized layout behavior of think-cell’s text boxes. Users can simply enter data either into the datasheet of the table or directly into the cells on the slide. The datasheet also allows for think-cell’s Excel link to ensure consistency with e.g., your Excel model.
Here’s a small outlook on the upcoming think-cell 12. Robin and I already discussed version 12 of think-cell and its continuous improvements for the table element. Beyond pure layout improvements, it also comes with new data-driven objects. Users can now define whether the table should display inserted data as text/numbers or directly as e.g., Harvey balls, checkboxes or pictures. Yes, pictures. When inserting URLs, think-cell will be able to directly display the image or icon in the table for you.
5. Data Automation, with Focus on Tableau
During the last decade, the amount of data getting accumulated is growing at an unbelievable rate. According to Statista, it is believed that by 2025, global data creation is projected to grow to more than 180 zettabytes.
Various other sources indicate CAGRs exceeding 50% and mention that 90% of today’s data has been generated in the last two years. With so much new data being generated, it would be good if people could absorb all this content. That isn’t happening. More worrying is that at the same time, the attention span of people is constantly decreasing. Audiences want just key facts and want to see the larger picture, possibly in the form of a chart or some other data visualization. Such data visualizations are not easy to create, and also not easy to understand. This sort of situation creates a big challenge—a challenge for data analytics and visualization software, that’s often met with platforms like Tableau and PowerBI.
To provide PowerPoint users with an another data source in addition to Excel and to ensure a seamless experience between PowerPoint and more complex data visualization software, think-cell introduced its powerful Tableau link feature. This feature adds an amazing integration with Tableau Online, the browser-based cloud version of Tableau that we will explore. With this feature, you can bring your data from published Tableau dashboards into your known PowerPoint charts. Of course, think-cell also works with Tableau Server, but that’s outside the scope of this post.
To make this integration work, you first need to add a browser extension to your web browser. The think-cell browser extension works in Google Chrome, Mozilla Firefox, and Microsoft Edge. You can see how the extension shows up in a web browser, as shown highlighted in red in Figure 10, below.
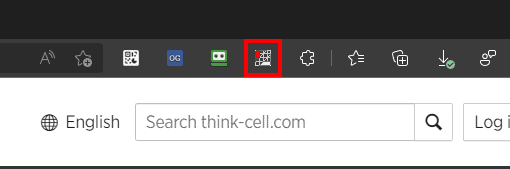
Figure 10: think-cell browser extension
While the features explained on this post are all amazing, you may also want to explore this video on basic think-cell concepts to understand working with the think-cell add-in.
Robin Jung on think-cell Licensing

Robin Jung is Head of Product Management at think-cell, where he is in charge of transforming the voice of the customers into new product innovations. He is a former MBB consultant and tech enthusiast, holding a Master in Management degree from HHL – Leipzig Graduate School of Management.
Geetesh: Robin, can you share some information about licensing think-cell within an organization?
Robin: think-cell is leased, not sold. The annual leasing fee is based on the number of users and covers usage, all updates, and upgrades as well as technical support.
Also, we license to people, and not to machines. Therefore, every individual who wants to use think-cell needs a personal license but can install it on any number of machines.
We ship our software electronically. Customers receive a link to download the software and a license key to activate it after installation. A license key can be used by several users, but of course only by the number of users for which you placed an order.
More information about licensing can be found on our How to Order page.
Geetesh: Most think-cell users are from larger organizations. What options do you provide for presentation designers or freelancers so that they can also use think-cell for their clients, or use it individually?
Robin: About options for presentation designers or freelancers, think-cell does have a minimum order quantity of 5 users. However, we are currently evaluating our future licensing strategy and are therefore interested in market feedback on e.g., single licensing. Because of the great relationship with Geetesh over so many years, we are happy to offer an extended trial of 60 days as well as the opportunity to purchase below 5 users (e.g., single licenses) to the Indezine community.