 (2 votes, average: 5.00 out of 5)
Do you see charts with data labels that read [CELLRANGE] rather than a real value or number? Do you see this behavior more in PowerPoint slides you receive from others, rather than the slides you create yourself? This is a known bug and can affect users of PowerPoint 2010 and older versions if they open slides with charts created in PowerPoint 2013 and newer versions.
Look at this chart created in PowerPoint 2016 for Windows, as shown in Figure 1, below. You will notice that the data labels have been highlighted in red.
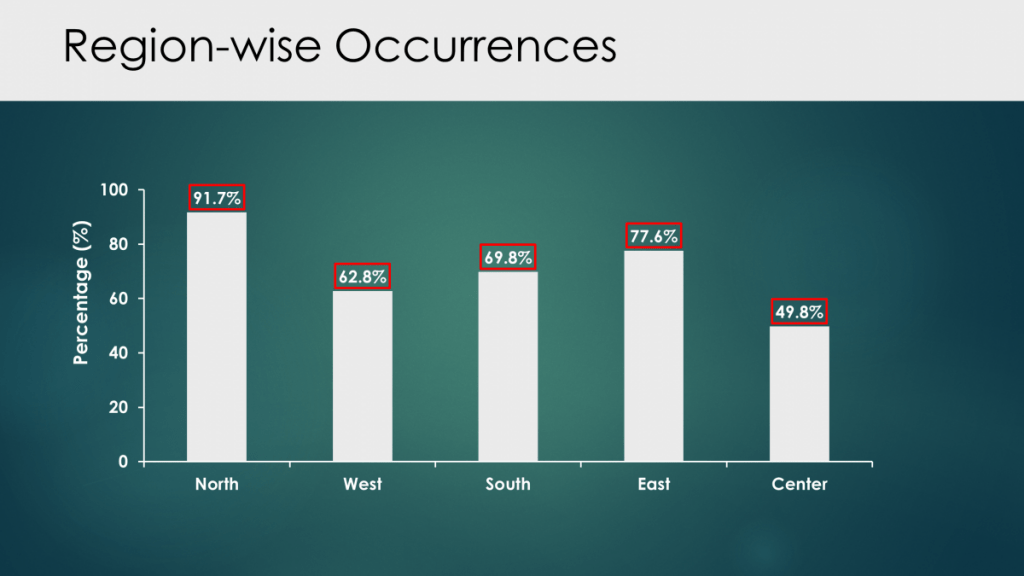
Figure 1: Slide with data labels in PowerPoint 2016 for Windows
Now open the same slide in PowerPoint 2010 for Windows, and you will not see the data labels you expect. Rather, each data label is now confusingly called [CELLRANGE], as you can see in Figure 2, below. Compare this slide with the same slide, shown in Figure 1, and you will realize that something is amiss in PowerPoint 2010 for Windows.

Figure 2: Slide with data labels in PowerPoint 2010 for Windows
Why does this happen? That’s because while PowerPoint 2013 and higher versions allow you to populate your data labels with specific values you place in the chart’s datasheet, PowerPoint 2010 and earlier versions only allow you to use either the exact value or the Series or Category names.
Look at Figure 3 below, where you can see Label Options for Data Labels. You’ll notice that we have opted to source Value From Cells.
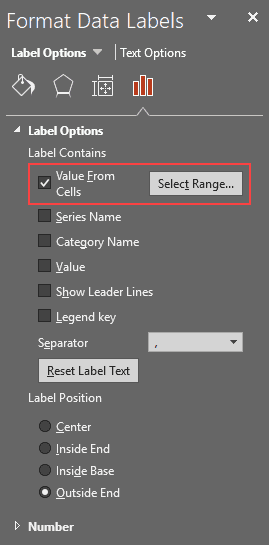
Figure 3: Values from Cells in PowerPoint 2016
This Value From Cells option is a huge improvement over the conventional Value option, and lets you choose a range different than the Values range in the Excel datasheet. To do so, you click the Select Range… button next to the Value From Cells option, shown highlighted in red within Figure 3, above.
As mentioned, clicking the Select Range… button brings up the Excel datasheet for this PowerPoint chart, as shown highlighted in in red within Figure 4, below. Also note the Data Label Range window, highlighted in green.
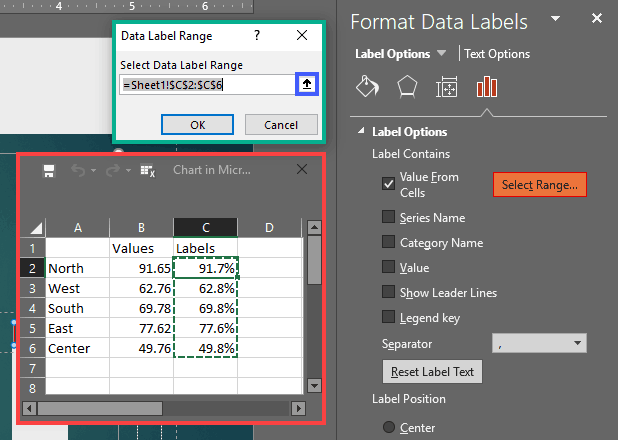
Figure 4: Select Range for Data Labels
Within the Data Label Range window, you will click the upward pointing arrow, highlighted in blue. You now select the range of cells to source your data labels, and click the upward pointing arrow again. Next, click the OK button in the Data Label Range window.
You will now see the data labels show values from your selected range. However, open this slide in PowerPoint 2010 or a previous version, and you will see all data labels read [CELLRANGE], rather than a real value or number!
This is because PowerPoint 2010 and previous versions provide fewer choices for data labels, as can be seen highlighted in red within Figure 5, below.

Figure 5: Label Options in PowerPoint 2010
Notice that there is no Value From Cells option, or a Select Range button, as shown previously in Figure 2, earlier on this page.
Workarounds for the [CELLRANGE] Data Label Problem
Predictably, Microsoft did not want to make these charts backward-compatible with older PowerPoint versions. So what can you do in such a situation?
Here are some ideas that will help. Note that the first two ideas need to be implemented in PowerPoint 2013 or a newer version before you send it to others who use older versions. The third idea will work for recipients who are using an older version.
1. Use a Picture of the Chart
Follow these steps:
- Drag the actual chart so that it placed outside the Slide Area. You can drag it rightwards or towards the bottom–or anywhere you want as long as it is not visible in the Slide Area.
- Next copy your chart to the clipboard.
- Don’t choose the Paste option. Rather choose the Paste | Paste Special option. In the resultant dialog box, choose to paste as an Enhanced Metafile (EMF).
- This EMF chart can now be placed within the Slide Area..
2. Create Data Labels Manually
This is a variation of the preceding idea. Follow these steps:
- Copy your chart, and paste it again into the same slide.
- Now drag the pasted chart so that it placed outside the Slide Area. You can drag it rightwards or towards the bottom–or anywhere you want as long as it is not visible in the Slide Area.
- Now remove all data labels from the chart.
- Deselect your chart. Next place a text box in the position where you want to place your first data label. Type in a value, and format the text box to choose a consistent font, font-size and color.
- Create duplicates of your data label text box, and place them as needed.
- Change values in the duplicated text boxes.
3. Reset Data Labels
Follow these steps:
- Right click any data label that reads [CELLRANGE], and choose the Format Data Labels option.
- In the resultant Format Data Labels dialog box (shown in Figure 5), click the Reset Label Text option. This will remove all data labels, so that you no longer see the [CELLRANGE] data labels.
- Still within the Format Data Labels dialog box, choose the Value option, and then Close this dialog box.
- You will now see the default values, but will lose any customization you made in the separate range for values. This can be problematic if you used percentages since the data labels may show values increased hundred-fold! In that case, you can use steps 1 and 2 from this section, and then use all steps in the preceding section.
Finally, if this annoys you and you would like Microsoft to know that you are unhappy, you can reach out to the PowerPoint development team via the UserVoice initiative. Learn more in our PowerPoint Feedback and UserVoice: Does This Go Anywhere? post.

Geetesh Bajaj is an awarded Microsoft PowerPoint MVP (Most Valuable Professional), and has been designing and training with PowerPoint for more than two decades. He heads Indezine, a presentation design studio and content development organization based out of Hyderabad, India.
Geetesh believes that any PowerPoint presentation is a sum of its elements–these elements include abstract elements like story, consistency, and interactivity — and also slide elements like shapes, graphics, charts, text, sound, video, and animation. He explains how these elements work together in his training sessions. He has also authored six books on PowerPoint and Microsoft Office.