 (2 votes, average: 5.00 out of 5)
Do you want to share live tweets in your PowerPoint presentation? Or do you want to put up signage in a public area that rotates tweets depending upon a particular user or hashtag? And what if you want to deliver this entire experience in a branded manner so that your company tweets show up on a screen that uses your company fonts, colors, and styling?
Yes, this is eminently doable–if you are connected online, or even otherwise, and we will explore how you can make this work if you are not connected later on this post. For now, let us see how you can make the tweets appear in PowerPoint in the first place. To make this magic happen, you will have to install a PowerPoint add-in from PresentationPoint called DataPoint.
 Thanks to Kurt Dupont of PresentationPoint for his help in creating this post. In fact, Kurt made many changes in DataPoint while we were creating this post, so that users can have a seamless, easy experience.
To follow this post, you can buy a copy of DataPoint, or download a trial version of the add-in. The trial version of DataPoint works identically to the full version for 15 days.
Follow these steps now:
- Create a new presentation in PowerPoint. PowerPoint typically starts with a single slide, and you can change the layout of this slide to Blank, so that it has no placeholders.
- Now access the DataPoint tab of the Ribbon, and click the List button, shown in Figure 1, below.

Figure 1: List Button in DataPoint- This brings up the Connections dialog box that is chock-a-block, full of connections that DataPoint can provide to data sources. Do take the time to go through this list, because it’s amazing to see these choices. For now, we scrolled down until we found Twitter, as can be seen in Figure 2, below. First, we selected Twitter, and then clicked the Add query button.
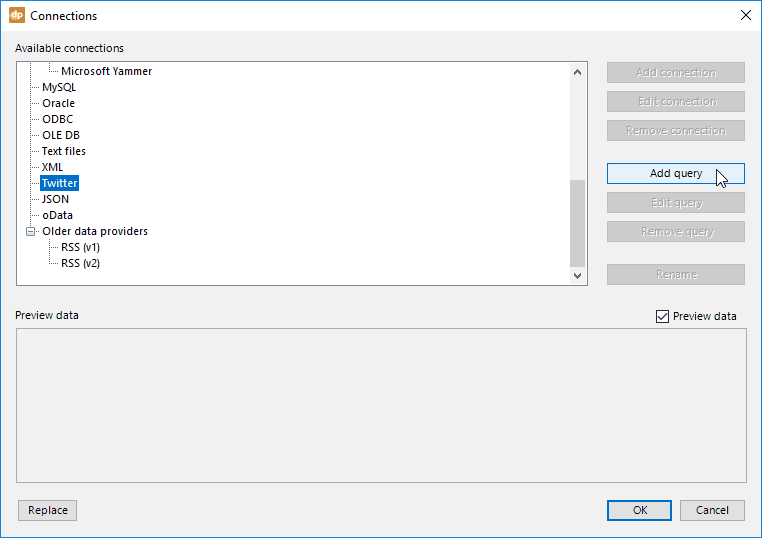
Figure 2: Connect with Twitter- This click summons the dialog box that you see in Figure 3, below. Now, this dialog box has enough options to keep you awake for a few hours, especially if you click the Advanced button, but we are going to keep this very simple. All we added was the Twitter handle name of the account from where we want to source our tweets. We also checked all the three options for excluding retweets, and downloading images. Finally, we disabled Continuous updating. If you are running tweets in a public place and won’t close the presentation for hours or days, you may want to select this option. Click OK when done.

Figure 3: Twitter Options in DataPoint- Wait a while until DataPoint sources the tweets (see Figure 4). Do note that we renamed the query to something descriptive, but this is not absolutely necessary. Click OK when done.
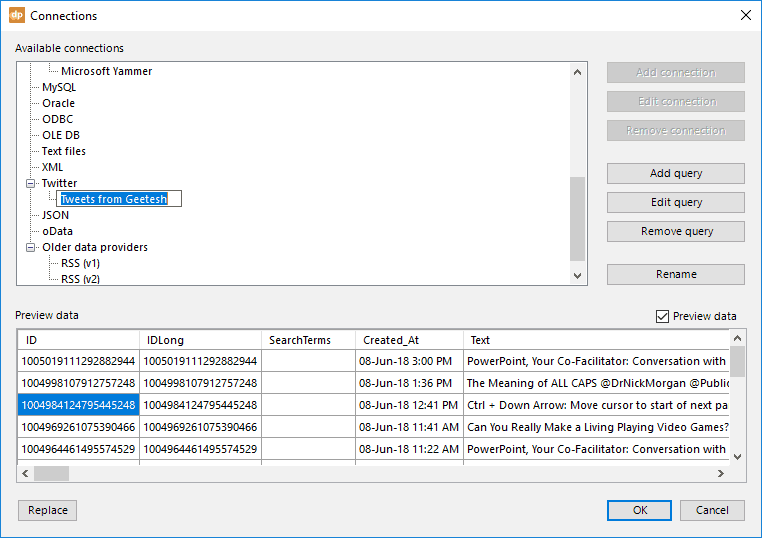
Figure 4: Twitter Data Sourced- We next inserted a shape. You can use any shape, but a fuller shape such as a Rectangle, a Rounded Rectangle or an Oval works best. With this shape selected, access the DataPoint tab of the Ribbon, and click the Picture button, as shown in Figure 5, below.
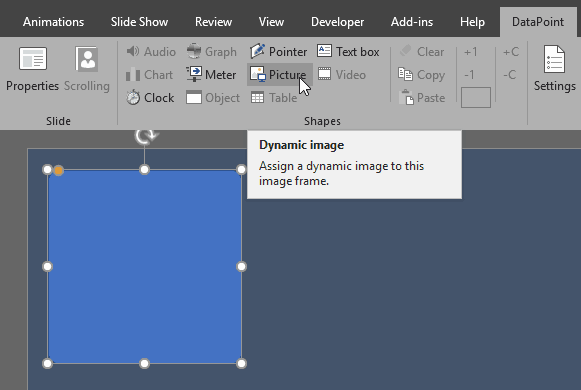
Figure 5: Add a Dynamic Image- This click brings up the Picture dialog box that you can see in Figure 6, below. In the Columns drop-down list, you can see a multitude of properties that DataPoint has sourced from Twitter. We selected the UserProfileImage property. Click OK when done.

Figure 6: UserProfileImage Property- You will now see a picture of the Twitter user profile now, as can be seen in Figure 7, below.

Figure 7: Twitter User Profile Image- Similarly, add another shape and connect this to another dynamic image. This time, use the FeaturedImage property. You will now see the featured image of the tweet now, as can be seen in Figure 8, below.

Figure 8: Profile and Featured Images Added- Note: While you can use any size you prefer, Twitter does crop featured images to the 2:1 proportion. Use this proportion by all means unless the Twitter account you selected uses pictures of another proportion. Once you make a choice, you can always resize this shape as necessary.
- Next, insert a text box. Now with the text box selected, access the DataPoint tab of the Ribbon, and click the Text box button, as shown in Figure 9, below.
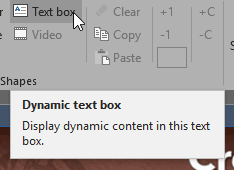
Figure 9: Add a Dynamic Text Box- This brings up the Text box dialog box, as shown in Figure 10, below. Access the Column drop-down list, and choose the Text property. Click OK when done.

Figure 10: Choose the Text Property- You will now see the tweet text on the slide. You can change the font, and the text size as needed. Make sure the text box is large enough to accommodate longer tweets.

Figure 11: Tweet added to slide- Similarly, add another text box for the Twitter handle. Use the From_User_Screen_Name property. You can also add another static text box before this text box and add the “@” character to make this appear more Twitter-like, as shown in Figure 12, below.

Figure 12: Add the Twiiter Account Name- Now save your presentation, and play it. DataPoint may take a while to refresh or load tweets, but soon enough you will see the slide refresh your tweets often.
Use DataPoint in Offline Mode
There is no denying to the fact that DataPoint really shines through when you are connected online because tweets can be refreshed and updated. But DataPoint does have an option to create an offline presentation that does not require constant updating. Sometimes, this approach can work, especially if you are not sure about the quality of online access, and this may happen often if you are showing your DataPoint-powered slides in an exhibition or conference.
You May Also Like: Tweeting Inside PowerPoint: Conversation with Kurt Dupont
[…] Featured on indezine.com!https://notes.indezine.com/2018/06/displaying-tweets-in-powerpoint-using-datapoint.html […]